

- ZeroTwo desktop app
- ZeroTwo on the web
The Visualizations preview is rolling out in the ZeroTwo desktop app. When
Visualize is available, type
@ in the composer, start entering
Visualize, and select Visualize under Plugins. The composer adds a
Visualize tag before your request.If Visualize doesn’t appear, use ZeroTwo on the web or try again after the
preview reaches your account.Check availability
The Visualize suggestion is the reliable sign that the preview is enabled
for your account. During the rollout, availability can differ across accounts,
workspaces, and app versions, even on the same plan.
Choose when a visualization helps
ZeroTwo can choose a visual format when it materially improves the answer. You can also tag@Visualize when you specifically want an interactive result.
Ask for the smallest format that fits the job:
- Use a diagram for labeled relationships or a process.
- Use a chart or plot for named numeric data and comparisons.
- Use a map for geographic information.
- Use an interactive visualization when inputs, time, motion, or spatial relationships should change.
- Use a Site when you need a durable hosted application with a shareable URL, permissions, or persistent data.
Prompt with an outcome and controls
A strong request names the outcome, source material, question, and useful interactions. Try this example:Explore interactive examples
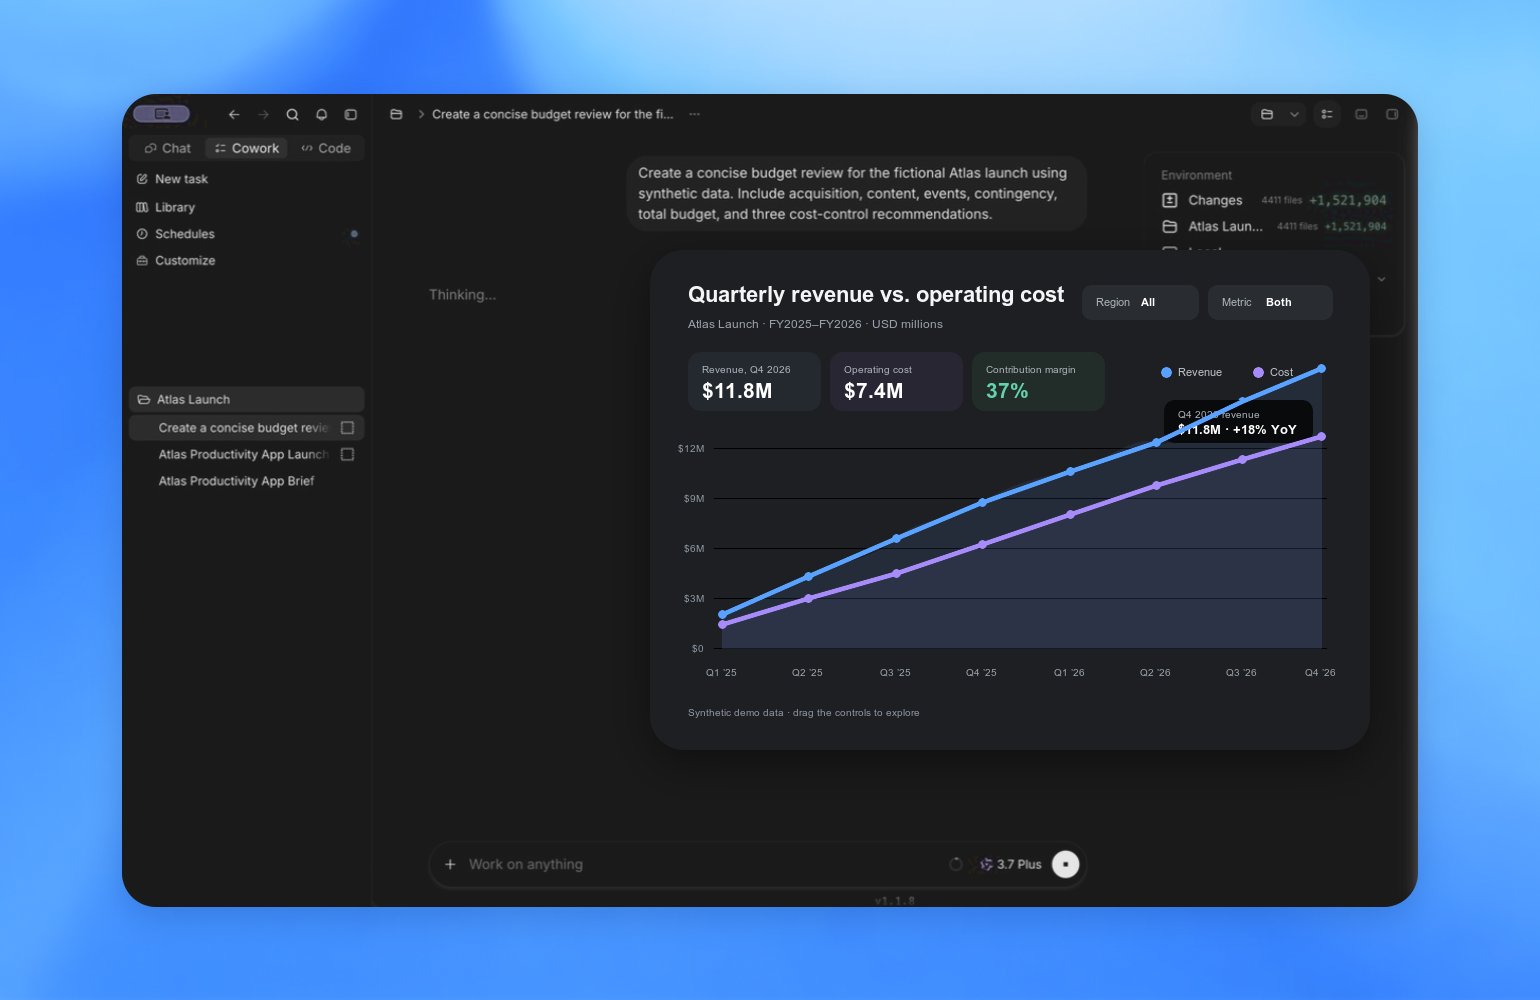
These examples reproduce three visualizations from the GPT-5.6 launch page. Use their controls to see how a focused prompt can become an interactive explanation, lab, or teaching tool.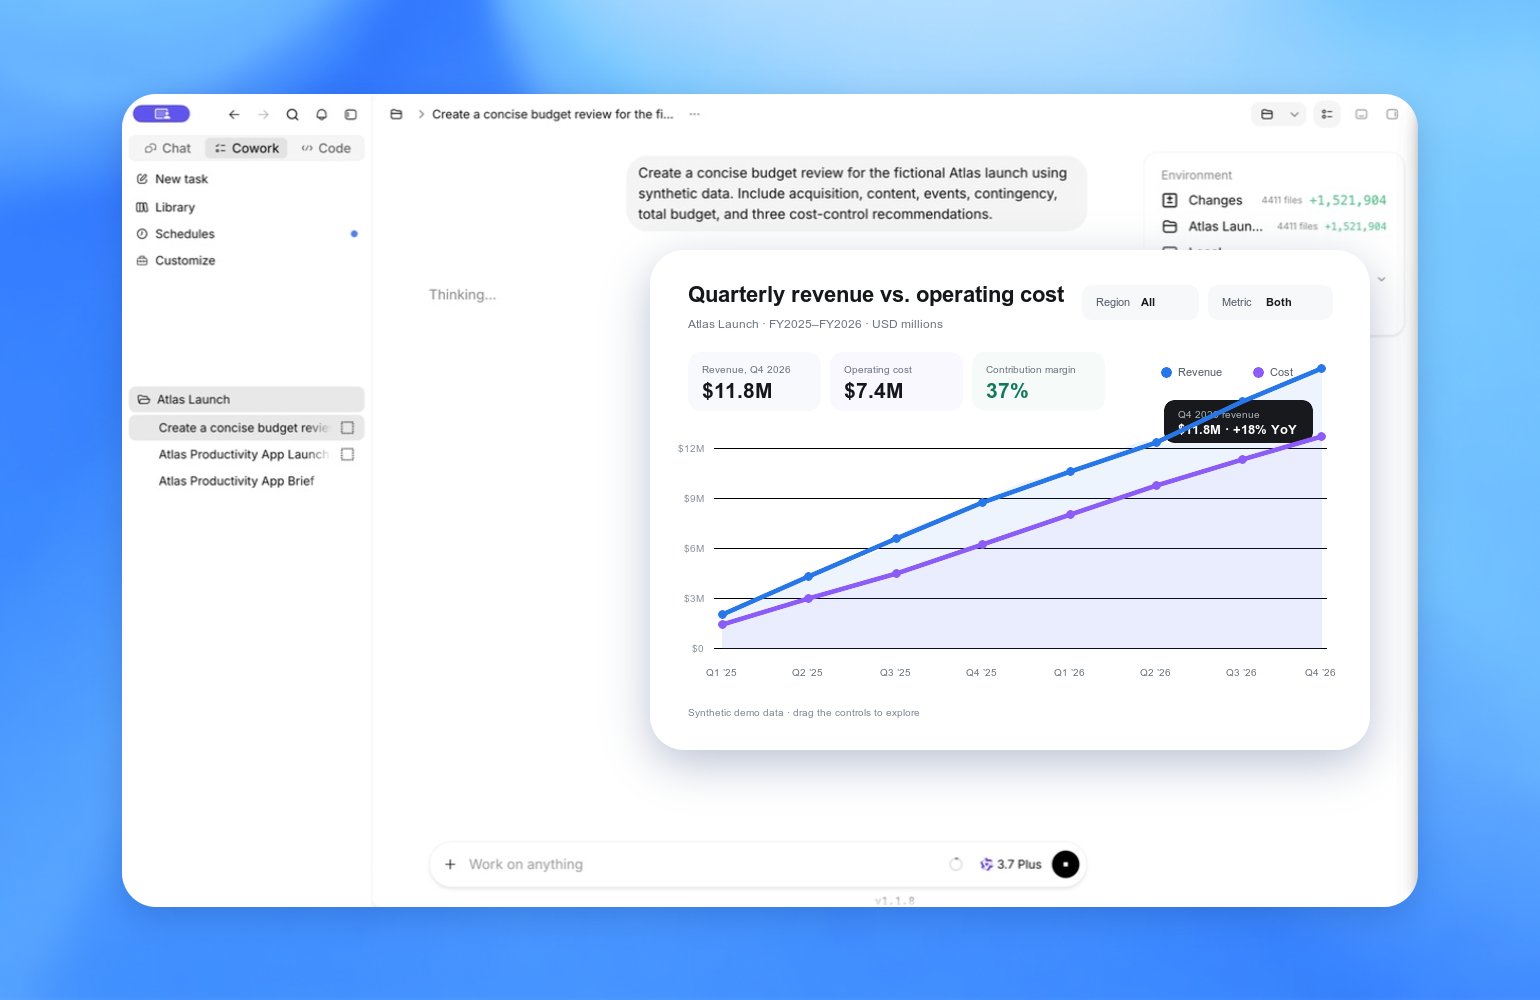
Refine and continue
Continue in the same chat and describe the change you want. Useful follow-ups include:- Add or remove a control, filter, comparison, or annotation.
- Correct the source data, units, labels, or assumptions.
- Simplify a slow result by aggregating, binning, or sampling the data.
- Add a concise text summary and a data table.
- Make every control keyboard accessible and add visible focus states.
- Use labels or patterns as well as color, and remove looping motion.
- Turn the result into a Site when it should be hosted and revisited.
Share or reuse a result
Use the chat’s standard Share action when it’s available. Review the entire shared chat first, including its source data and earlier messages. A visualization is generally a snapshot of the information available when ZeroTwo created it, not a live dashboard that stays synchronized with a connected source. Generated download controls and export formats can vary by result. If an export doesn’t work, ask ZeroTwo for the underlying data in a simpler format or ask it to turn the visualization into a Site.Improve accessibility
Generated visualizations aim to use semantic controls, visible focus, readable contrast, and reduced motion, but the result can vary. Check the visualization before sharing it. Ask ZeroTwo to add a text summary and data table, label axes and units, avoid relying on color alone, and make controls work from a keyboard.Recover from a failed result
Visualizations can take a minute or longer to generate. If the result is blank or missing, wait for the response to finish, reload the chat once, and then retry. If it still fails:- Ask for a smaller or simpler visualization.
- Aggregate or bin data, sample fewer points, or reduce precision in a large dataset.
- Remove a generated control or library that isn’t working.
- Verify important values, geographic boundaries, and source assumptions.
- Ask for a chart, diagram, table, or Site instead.